

Almost every small business runs its reporting the same way: someone exports data from two or three systems into a spreadsheet, cleans it up by hand, and produces a monthly summary that is accurate on the day it is finished and steadily less accurate every day after.
This works until the business grows past the point where one person's manual effort can keep pace. This guide covers business dashboards and reporting for a small business: what a real dashboard actually solves, the data-quality prerequisite that determines whether any of it works, and when building one is genuinely premature.
Where Spreadsheet Reporting Actually Breaks Down
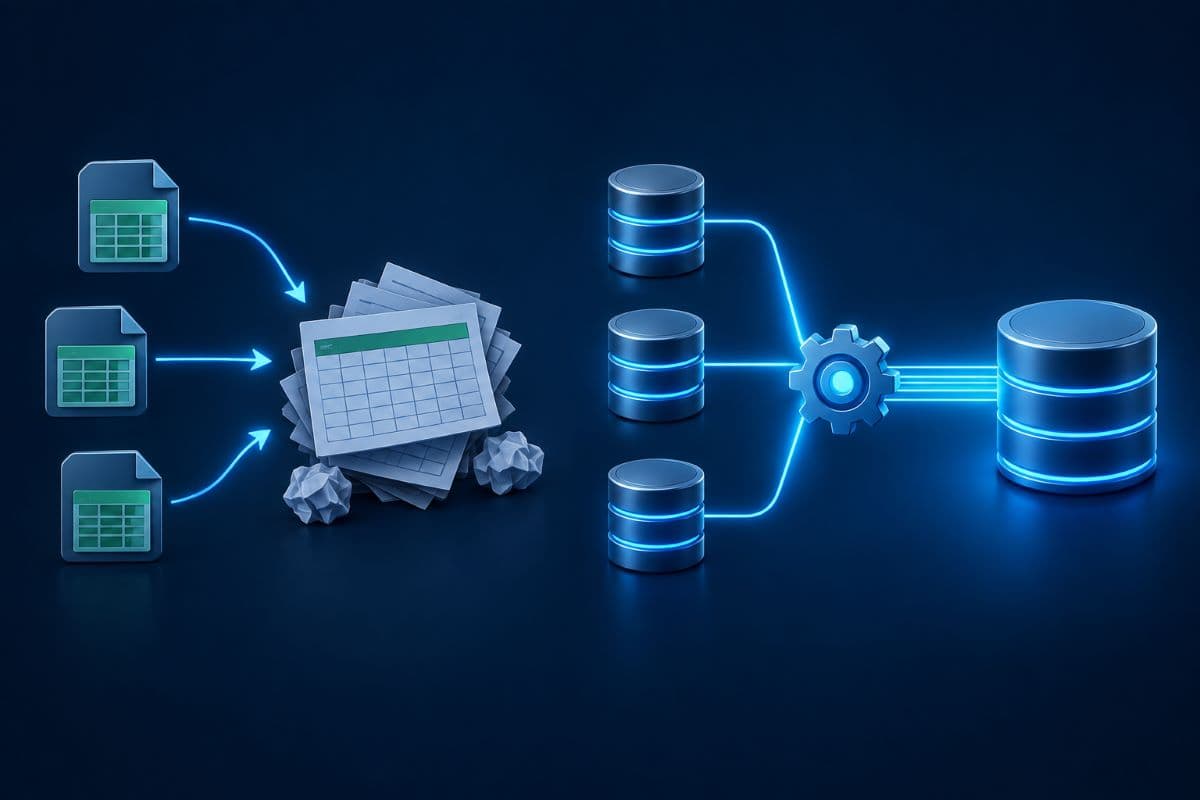
Spreadsheets are genuinely good tools, and the failure mode is not the spreadsheet itself. It is the manual assembly process around it: exporting from multiple systems, reconciling formats that do not quite match, and repeating that entire process every reporting cycle.
This breaks down in three predictable ways. The work consumes real hours that scale with the business rather than shrinking, the output is stale from the moment it is produced, and the whole process usually depends on one person who understands how the file was built.
The Single-Person Dependency Is the Sharpest Risk
A reporting process living inside one person's spreadsheet knowledge is a genuine business continuity problem, not just an efficiency one. When that person leaves or is unavailable, the business often discovers it cannot reproduce its own numbers, which is a more serious situation than simply losing some time.
What a Dashboard Actually Solves
A properly built dashboard connects directly to the systems holding the data, refreshes on a schedule, and presents current numbers without anyone reassembling anything manually. The value is not prettier charts; it is removing the human assembly step entirely.
Once that step is gone, reporting stops being a monthly project and becomes something available whenever anyone needs it. Questions that previously required a data request become something a manager answers themselves in a minute.
Self-Service Access Changes How Decisions Get Made
The genuine behavioral shift is that people start checking numbers before making decisions rather than after, simply because checking became easy. A business where anyone can see current performance without asking tends to catch problems considerably earlier than one where numbers arrive monthly.
Which Systems Actually Need to Connect
Most small businesses hold their meaningful numbers across a handful of systems: accounting, whatever tracks customers or clients, and something operational specific to the industry. Mapping which of these actually need to feed reporting, before evaluating any tool, keeps the project scoped to something achievable.
Businesses that attempt to connect everything at once typically stall, because each connection carries its own setup and data-quality work. Starting with the two systems that answer the most important questions produces something useful considerably faster.
Some Systems Connect Easily and Some Genuinely Do Not
Modern cloud applications usually offer clean connection methods; older or industry-specific software sometimes offers only a manual export. Confirming this early prevents a project plan built on an assumption that turns out to require substantial custom work or, in some cases, is not practical at all.
The Data Quality Prerequisite Nobody Mentions
Here is the part that determines success and that vendor demonstrations skip entirely: a dashboard built on inconsistent underlying data produces confidently wrong answers faster than a spreadsheet did. If two systems record customer names differently, if categories are entered inconsistently, or if the same transaction can appear in two places, no amount of visualization fixes that.
The unglamorous prerequisite is cleaning up how data is entered and structured in the source systems first. Businesses that skip this step build dashboards nobody trusts, which is a worse outcome than the spreadsheet they replaced, since at least the spreadsheet's limitations were visible.

Start by Agreeing What the Numbers Actually Mean
A surprisingly common blocker is that different people in the same business define core metrics differently. Settling what counts as a completed sale, an active client, or a billable hour, in writing, before building anything, prevents a dashboard that technically works while everyone disputes its output.
Licensing and Access Are Real Considerations
Business intelligence tools price by user, and the cost of giving everyone access adds up in ways businesses do not always model upfront. Many small businesses land on a smaller number of people building and publishing reports, with wider access to view finished dashboards rather than full authoring rights for everyone.
Where these tools are bundled into an existing productivity suite, a business may already have partial capability without realizing it, which is worth confirming against your current Microsoft 365 services before purchasing anything additional.
Comparing the Two Approaches Honestly
Dashboards Are Not the Same as Analysis
A dashboard shows what is happening; it does not explain why or decide what to do about it. Businesses sometimes expect the visualization itself to produce insight, then feel disappointed when they are looking at accurate numbers that do not tell them anything they did not already suspect.
The value comes from the questions people ask once numbers are easily available, and from the habit of checking before deciding. A dashboard that gets checked weekly by someone who then acts on what it shows is worth considerably more than a sophisticated one nobody opens.
Design Around Questions, Not Around Available Data
The most common design mistake is building a dashboard around whatever data happens to be accessible rather than around the questions the business actually needs answered. Starting from the question produces something people use; starting from the data produces a display of numbers with no clear purpose.
Connected Data Sources Carry Security Weight
A dashboard connecting to financial systems, client records, or operational data is a new pathway to sensitive information, and it deserves the same access thinking applied to those source systems. A dashboard that shows everyone the full client list because that was the easiest way to build it has quietly widened access considerably.
Row-level access controls, where different viewers see only the data relevant to their role, exist in most serious tools and are worth configuring rather than skipping. This is a direct extension of the same access control discipline governing the underlying systems.
Regulated Businesses Need to Be Particularly Careful Here
A practice or firm handling regulated data should confirm where dashboard data is actually stored and processed, whether it leaves the environment the regulated data is supposed to stay in, and whether the tool's own terms are compatible with existing obligations. This is a question to settle before connecting anything, not after.
Historical Data Determines What Trends You Can See
A dashboard can only show trends across periods where clean data actually exists, which means a business connecting systems for the first time may have limited historical depth to work with initially. This is worth setting expectations around, since the most useful comparisons, this quarter against the same quarter last year, may not be available immediately.
The practical implication is that the value of reporting compounds over time rather than arriving fully formed. A dashboard's first month is useful; its second year is considerably more useful, provided the underlying data stayed consistent throughout.
Changing How You Record Data Breaks Historical Comparison
A business that changes its categories, definitions, or systems mid-stream creates a discontinuity in its own trend data, which is a reasonable price for a genuine improvement but worth doing deliberately. Documenting when and why a definition changed keeps future comparisons interpretable rather than confusing.
When Building Dashboards Is Genuinely Premature
Not every business needs this yet, and pretending otherwise wastes money. A business whose reporting takes an hour a month, whose data lives in one system already producing adequate reports, or whose source data is currently too inconsistent to trust, is better served fixing those conditions than building on top of them.
The honest trigger is when manual reporting effort has become genuinely significant, when decisions are being delayed waiting for numbers, or when the single-person dependency has become a real risk. Absent those signals, this is a project worth deferring.
Mobile Access Deserves Explicit Consideration
Business owners and managers frequently want to check numbers away from a desk, and a dashboard that works well on a large monitor is often unreadable on a phone. If mobile viewing matters, it should be a design consideration from the start rather than something discovered after the layout is finished.
This also connects back to security: a dashboard accessible from any device is a dashboard whose access controls matter more, not less, since the convenience that makes it useful is the same convenience that widens exposure if credentials are compromised.
Automated Distribution Is Often More Useful Than the Dashboard Itself
Many people who need numbers will never habitually open a dashboard, however well built it is. Scheduled delivery, a weekly summary arriving where those people already look, frequently produces more actual usage than the interactive version everyone was excited about.
The two approaches complement each other: scheduled summaries for people who need awareness, interactive access for people who need to investigate. Deciding which people fall into which category prevents building only for the smaller group.
A Practical Way to Start
Start with one report that matters and that currently costs real effort, rather than attempting to build a complete reporting environment at once. A single working dashboard that replaces a genuinely painful manual process builds both confidence and internal understanding of what the effort actually involves.
From there, expand based on what people actually ask for rather than what seems useful in principle. Dashboards built speculatively tend to go unused, while dashboards built to answer a question someone was already asking tend to get checked regularly.
Assign an Owner Before You Build
Someone needs to own each dashboard: verifying it still reports correctly as source systems change, updating it when definitions shift, and retiring it when it stops being useful. An unowned dashboard drifts into inaccuracy quietly, and an inaccurate dashboard people still trust is worse than no dashboard at all. For businesses without internal capacity for this, it fits naturally into an existing managed IT services relationship rather than becoming another orphaned system.
Keep the First Version Simple
The temptation with a new dashboard is to include everything anyone might want, which produces something visually busy that nobody reads carefully. A first version showing a small number of genuinely important figures gets used, and additions can follow once people know what they actually reach for.
Better Numbers, Available Sooner
The point of business dashboards and reporting is not attractive visuals; it is removing the manual assembly step that makes reporting slow, stale, and dependent on one person's availability. Businesses that clean up their source data first, start with one genuinely painful report, and assign real ownership get that benefit. Businesses that skip those steps build something nobody ends up trusting.
For businesses in the region, a partner providing IT support in Santa Clarita can assess whether your data is actually ready before you invest in building anything.
Companies across the metro can get the same locally through managed IT services in Los Angeles, from the first data cleanup to a dashboard someone actually owns.
Frequently Asked Questions
When manual reporting effort has become genuinely significant, when decisions are being delayed waiting for numbers, or when the process depends on one person whose absence would leave the business unable to reproduce its own figures. A business whose reporting takes an hour a month and whose data lives in one adequate system is better served deferring this project.
Inconsistent underlying data. A dashboard built on source systems that record information inconsistently produces confidently wrong answers faster than a spreadsheet did, and no amount of visualization fixes that. Cleaning up how data is entered and structured in the source systems, and agreeing in writing what core metrics actually mean, has to come first.
They can, since a dashboard connecting to financial systems or client records creates a new pathway to sensitive information. A dashboard that shows everyone full data because that was easiest to build has quietly widened access considerably. Row-level access controls, where viewers see only data relevant to their role, exist in most serious tools and should be configured rather than skipped.
A specific named person or provider responsible for verifying it still reports correctly as source systems change, updating it when metric definitions shift, and retiring it when it stops being useful. An unowned dashboard drifts into inaccuracy quietly, and an inaccurate dashboard that people still trust is a worse outcome than having no dashboard at all.
If your business dashboards and reporting still depend on one person rebuilding the same spreadsheet every month, GlobeVM can assess whether your data is ready and help build reporting that maintains itself.
Comments
0 Comments